.avif)


This is a common challenge I run into multiple times a year. Instead of solving it from scratch every time, I figured it’s worth documenting some of the different approaches. This both shares the knowledge and offers a place for me to revisit all the solutions when I need them 😉
Also, a quick side note, all blogs are released in advance on our website - be sure to check it out: Metis BI Blog | Power BI Tips, Best Practices & Insights
So, what's the challenge?
In summary, we try to join two sets of data that are at a different grain - level of detail! To bring this to life, the challenge we have is that Sales are at the daily level, but Budget is provided at the monthly level. This misalignment in granularity creates a reporting challenge. How do we compare sales to budget?
To address this, we will explore three different approaches in this blog, not to say there aren't more. If you know of any, please share!
- Splitting the monthly budget down to the daily level: This method distributes the budget evenly across days in the month. It does take more effort though, and requires the end-users to be aware of this this is calculated to avoid any confusion.
- Keeping the budget at the first day of the month: Instead of forcing a daily allocation, we establish a direct relationship between Budget and a Date table. However, this does require us to derive first day of each month and assign the budget here.
- Using TREATAS with a disconnected Budget table: Here, the Budget table remains disconnected from the Date table unlike the above two options. We use the TREATAS function within a DAX measure to pass the filter context, such as month and year to the Budget table.
Why Consider These Approaches?
Each approach has its strengths, and the choice depends entirely on your organisation’s reporting requirements.
- Splitting by Day: If the business needs to track budget performance at a daily level, so monitoring how daily sales trend against an expected daily allocation, this approach makes sense. It also allows for more flexible calculations like moving averages or trend analyses.
- Keeping Budget at Month Level: If the budget is never intended to be used at the day grain, then forcing it down to that level might create confusion. This approach keeps the budget’s original intent intact while still allowing comparisons at the month or higher levels.
- Using Disconnected Budget Table: Instead of creating a relationship between the Budget and Date tables, this approach keeps Budget as a standalone table and uses TREATAS in DAX measures to apply filters dynamically.
But I want to call out, there is no best approach here. It depends on your organisation’s structure and reporting needs. So, I will share these methods I have used in the past to address this issue and to be fair, they seem to be the standard.
So, what Are We Trying to Achieve?
- Model the data appropriately so we can compare sales to budget
- Derive measures such as "% of Budget Achieved" and "Remaining Budget to Achieve £"
Let's have a look at the data model we will work with
Before getting into the three approaches, let's have a look at the tables and their structure. Here’s what we are working with:
- Fact Sales: At the daily grain
- Fact Budget: At a monthly grain - represented by first day of each month
- Dim Date: Includes standard date columns
- Dim Team: Contains the list of unique teams
Approach 1: Splitting the Monthly Budget to the Daily Level
We will start with splitting the monthly budget down to the daily level. In summary, this method distributes the budget evenly across days in the month. It’s important to provide some training to end users so they understand how the data behaves. If they drill down to the daily grain, they should be aware that the budget is simply the monthly total divided by the number of days in the month.
Step 1) Include Year & Month in Fact Budget
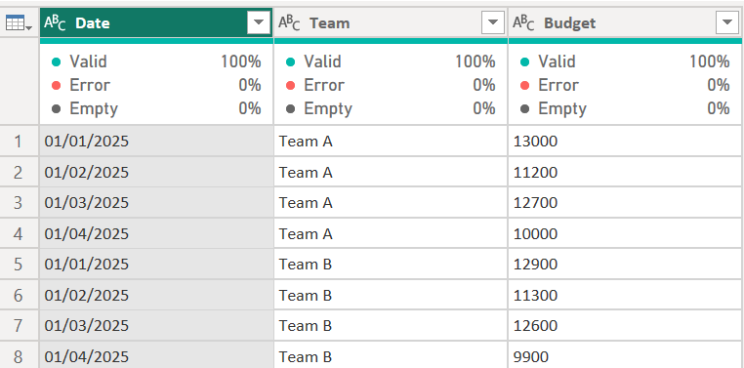
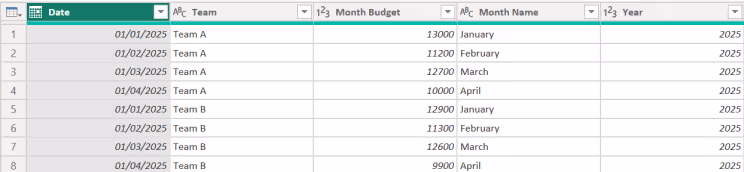
Below, you can see the initial table for Fact Budget. As explained, we have first day of each month and the budget assigned against it.
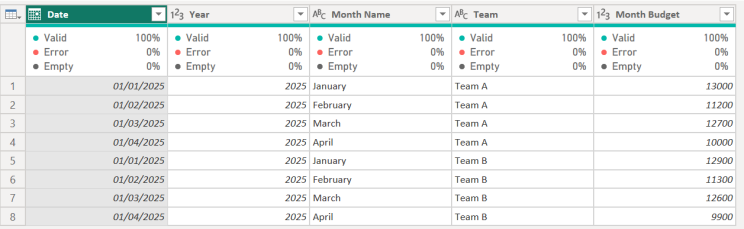
We need to derive the Year and Month, which is straightforward in Power Query, since we have a date. Simply select the date column, go to add column ribbon, and select relevant details from date option. The result should be as the below:
So, why are we doing this? Since the Budget is stored only on the 1st of each month, we need to spread it across all days to match Sales. We will need to merge the Fact Budget with date, and for this reason we want to merge it on Year and Month. As you read on, it will make more sense.
Step 2) Expand Budget to the Daily Level
Now that we have derived the Year and Month from Fact Budget, the next step is to expand the monthly budget across all days in the month. Since our Fact Budget table only has the first day of each month, we need to ensure that each team’s budget is available for every single day of the month. To do this, we will with our Dim Date, which contains all the dates and the Days in Month column - which is important.
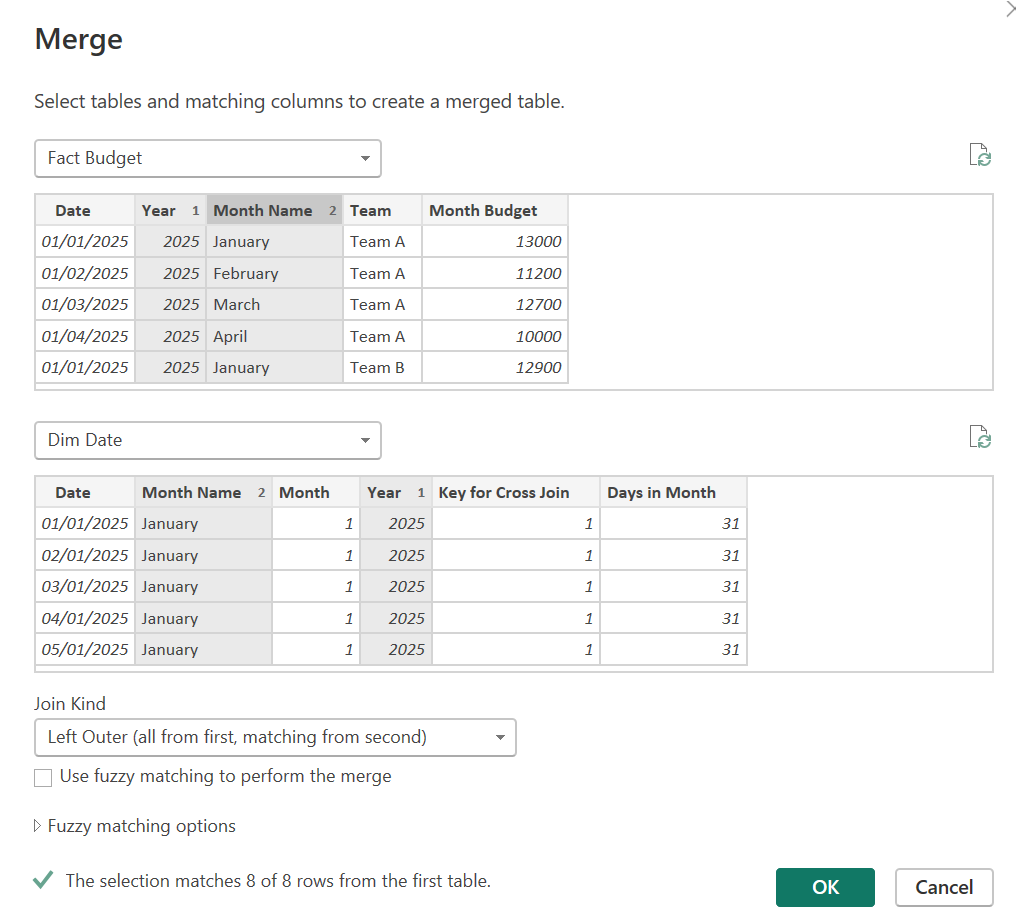
As you can see below, I have selected the Fact Budget table and used "Merge Queries as New". I joined on Year (Fact Budget) → Year (Dim Date) and Month (Fact Budget) → Month (Dim Date). Notice, you can select multiple columns from a single table and they are numbered as you can see below. Think of these as creating a composite key to carry out the merge.
I then expanded the merged table and selected the below:

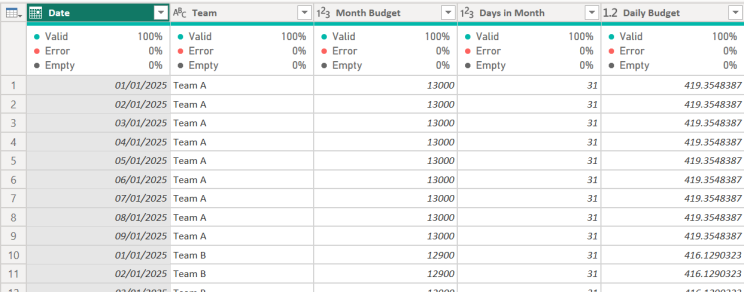
Notice now what we have achieved below. We have expanded the budget table to the day level:

I want to keep only the following columns: Date (from Dim Date, not Fact Budget), Team, Month Budget, Days in Month as per the below table:

At this point, each team’s budget is repeated for every day of the corresponding month.
Note: I selected "Merges Queries as new" therefore this is a new table, and I called it "Budget Expanded".
Step 3) Calculate Daily Budget
Now that we have expanded the Fact Budget table to the daily level, the next step is to allocate the budget evenly across all days in the month. Since the Month Budget is the same for each day, we need to divide it by the number of days in the month to get a Daily Budget value. So, nothing too complex here. Easy!
To calculate the Daily Budget, simply go to the Budget Expanded table, click on the "Add Column" ribbon and select "Custom Column". From here we just enter the formula: Daily Budget = [Month Budget] / [Days in Month]. We should not have the following table:
So, each day now has an equal share of the monthly budget. Again, as mentioned right at the beginning, this needs to be confirmed with the business you are working with. Maybe this breakdown does not make sense, maybe it should be by working days, what happens to bank holidays? Maybe it should be weighted, etc. The point is, communicate the approach with the right people, and get approval. Finance or Financial Planning are usually involved with budgets and forecasts in my experience. Also, most departments deriving budgets do this at the month/financial period or quarter level. However, when we go down to an operational level, that’s where this need may be voiced more.
🧠🤔 Hmmmm…. Combine or Not Combine Fact Sale and Fact Budget 🤔🧠
Now that Budget and Sales are both at the daily level, we could merge them into a single Fact table. This would make it easier to compare actuals vs budget in one place. However, I’ve decided to keep them separate and really, always would. The main reason is that Budget is only broken down by Team and Date, whereas Sales usually would have additional details - such as product categories, regions, transaction types and other attributes that Budget won't have. Yes, budget is not on the day level but we forced it! By keeping them separate, we maintain flexibility in our reporting, ensuring that both can scale independently without forcing unnecessary granularity onto Budget.
Step 4) Rename and Hide the Original Budget Table
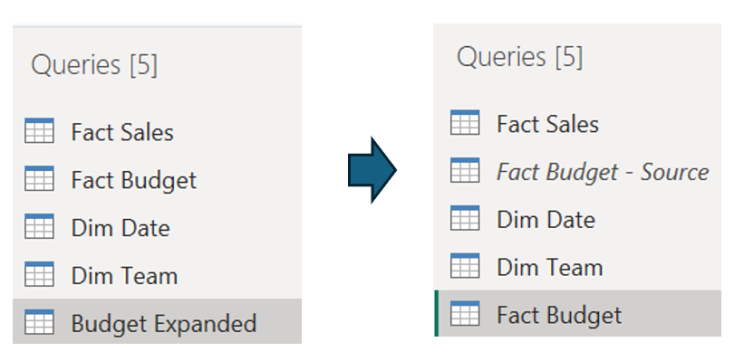
As you know, we derived a new table with the merge - we could have just applied it in existing table, but I always like to keep the source or raw data as it is when brought in, that way I can easily see it with no transformations - uncheck "Enable load". So, now that we have a fully expanded budget table at the daily level, we no longer need the original Fact Budget table in our data model. However, like I said, we must not delete it - instead, we will rename it and stop it from loading into the data model.
So to make sure we are aligned, why am I doing this?
- Preserve the Original Data: Keeping "Fact Budget - Source" allows us to trace back to the original monthly budget values if needed.
- Prevent Confusion: If both tables are visible, users might mistakenly use the wrong one.
- Ensure Best Practice: We only want to expose tables that are needed for reporting, keeping our model clean and tidy.
Below is the before and after. Notice, "Fact Budget - Source" is in italic format - disabled "Enable load".
So, at this stage, our data model is clean and structured. Now, we can start building measures for reporting, such as % of Budget Achieved and Remaining Budget (£). Hooray!!!
Step 5: Load Data and Apply Relationships
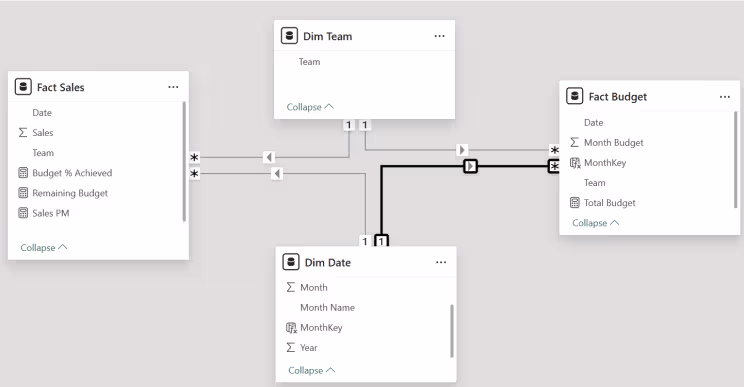
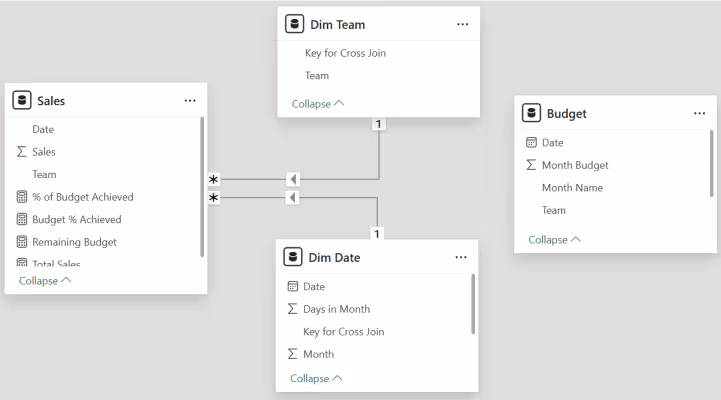
Now that we have our Fact Sales and Fact Budget tables both at the daily grain, we load them into Power BI (data model) and establish relationships with our dimension tables. See the below image:

Note: This setup is meant to illustrate the budget topic of this blog. In a real scenario, additional elements should be incorporated to align with best practices in data modelling. So, things like including primary and foreign key relationships. If you need help with this, reach out!
Step 6: Creating Key DAX Measures
We are now in the lovely world of DAX. So, as mentioned at the beginning we need core measures. So, below is what we need to derive:
Budget % Achieved =
DIVIDE([Total Sales], [Total Budget])

Remaining Budget to Achieve £ =
[Total Budget] - [Total Sales]
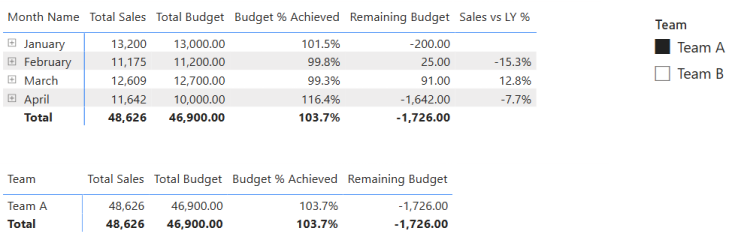
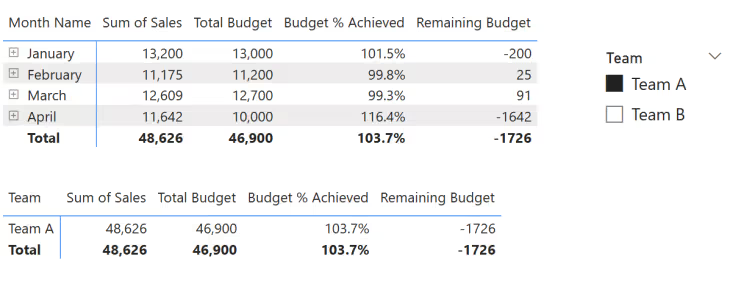
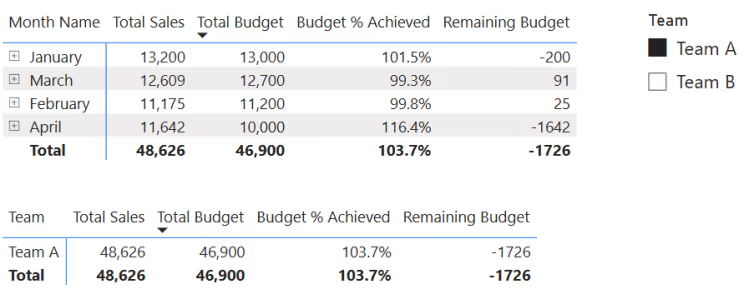
Notice below, we get the result required. I have selected an individual team, and I can see: Sales, Budget, % Achieved and Remaining Budget.
Step 7: Understanding Granularity Issues
So far, everything looks great when we view the data at the monthly level. Sales and Budget align, and our key measures Budget % Achieved and Remaining Budget behave as expected.
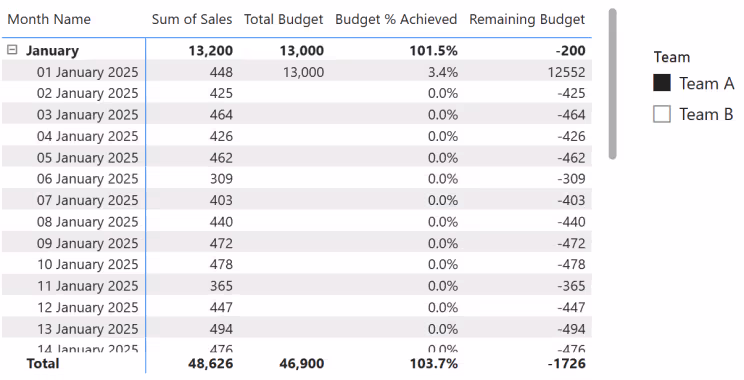
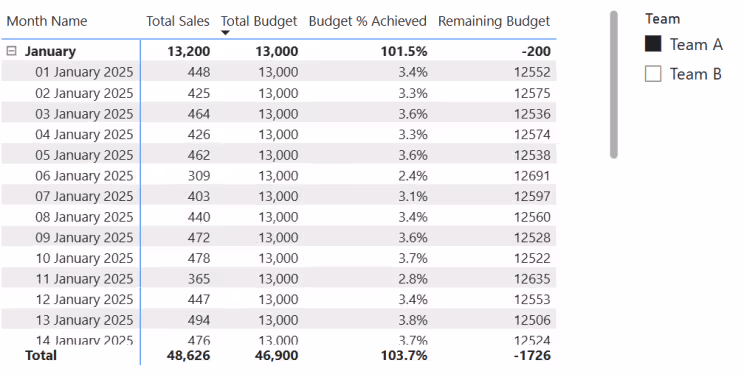
However, this is where we need to be careful when looking at different levels of granularity. So, what happens if we go to the daily level?

Notice above, at the daily level, the budget can be misleading as the budget was not set per day, it was just divided evenly. If an end-user drills down to individual days, they might assume the budget was actually allocated at a daily level, which is NOT true. At the month level the total budget for January is £13,000, total sales is £13,200, and Budget % Achieved is 101.5% - this is all correct.
However, at the day level, a single day might show £419.35 Budget and £500 Sales, which could incorrectly suggest that sales outperformed the budget on that day, when in reality, the budget was never defined at a daily level. So, again, it's important this is showcased and understood by those who are using the report. If your users need to drill down to the day level, they should be informed of this. The last thing we want is for people to misunderstand the data.
Okay, so that’s it for the first approach… what do you think?
Approach 2: Keeping the Budget at the First Day of the Month
Moving on to the second approach which is keeping the budget at the first day of the month. So, instead of forcing a daily allocation, we establish a direct relationship between Budget and a Date table.
Step 1: Derive First Day of Month
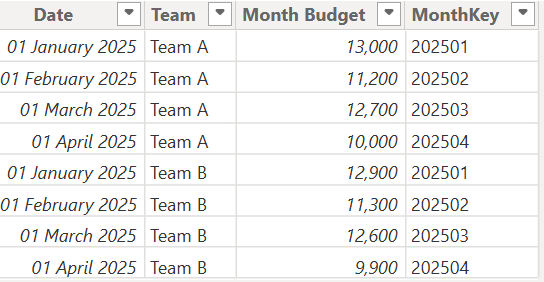
We will use the same tables as above, but I can imagine many of you may not have first day of the month, instead a column with the format YYYY-MM, such as "2025-02". So, there are multiple ways to derive the first day of the month from such format so I won't highlight it below. But, if you ask me, put a request in with those providing the budget files to do so there and give you the file 😉 Below, you can see I have first day of month and the budget is allocated here:
Step 2: Create a Relationship Between Date Table and Budget Table
If you don’t already, please make sure you always have a date table (dimension) in your Power BI solutions. Regardless of industry, you need one! So, you can see below the Fact Budget, the date is selected and notice, it has first day of January, February, etc. In first approach, we did not just have the first day of every month for budget.
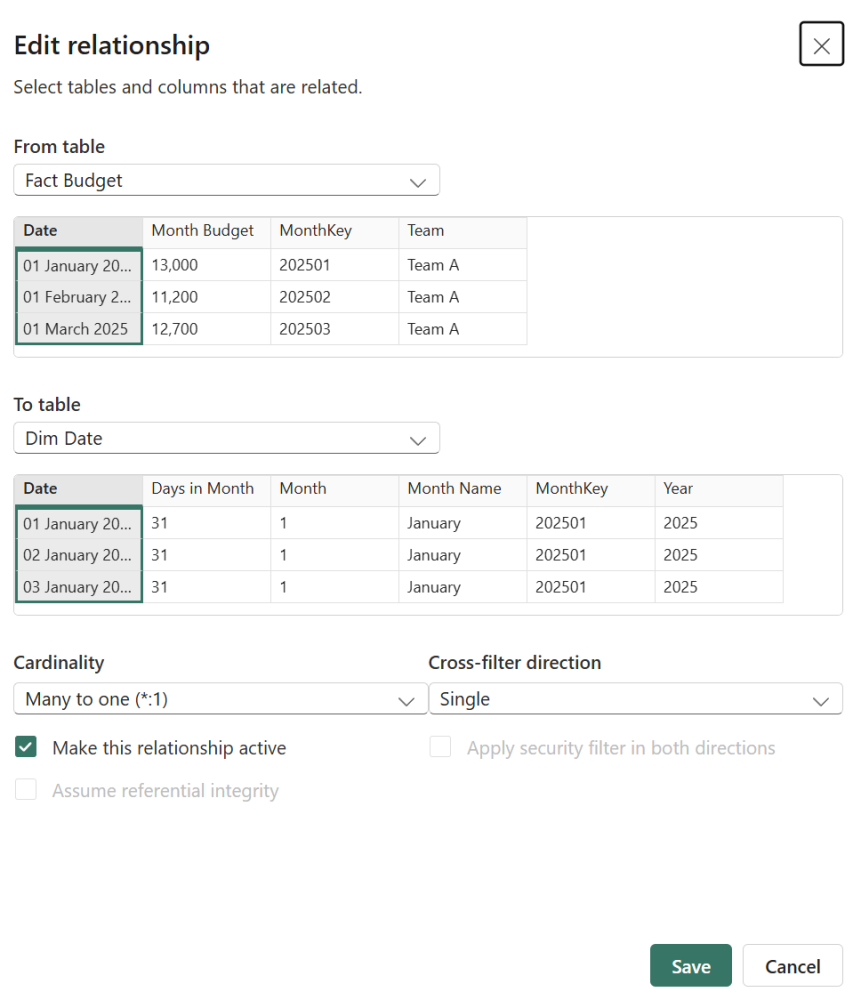
Below is the end result of the data model. Again, looks same as approach one. However the relationship between Dim Date and Fact Budget is based on "first Day of Month". We have not expanded the budget to the day level.
Step 3: Finish by Creating Key DAX Measures
This is more or less a copy from above. Below is what we need to derive:
Budget % Achieved =
DIVIDE([Total Sales], [Total Budget])

Remaining Budget to Achieve £ =
[Total Budget] - [Total Sales]
Notice below, we have achieved the same result as we did with approach 1.
However, notice the difference below:
The key difference between the two approaches so far is in how the budget is displayed on the daily level. So, in the first approach, the budget is evenly distributed across all days in the month, meaning each day gets a proportionate share of the total monthly budget. This allows for day-to-day comparisons but can be misleading if users assume the budget was actually planned at a daily level.
In the second approach, the budget is assigned entirely to the first day of the month. This ensures that comparisons remain valid at the monthly level but results in an empty budget when drilled down to individual days beyond the first.
Let's not move on to the final approach I wanted to share.
Approach 3: Disconnected Budget Table and TREATAS
Instead of creating a direct relationship between the Budget and Date tables as we saw above, this approach keeps the Budget table as a standalone (disconnected) table and applies filters dynamically using the TREATAS function in DAX. Confused? Don’t' worry it will make sense below.
Step 1: Ensure Year and Month Exist in the Fact Budget table
Since we are not establishing a direct relationship between Fact Budget and Dim Date, we need to ass a Year and Month column in our Budget table. This allows us to apply the correct filters when using TREATAS. Notice below, I derived these two columns at the end of the table.
Step 2: Keep Budget Table Disconnected from Dim Date
Unlike previous approaches, we do not create a relationship between Fact Budget and Dim Date. None at all 😀 Instead, the Budget table remains completely disconnected from the data model as the below shows.
Step 3: Creating Key DAX Measures using TREATAS
Now, we use TREATAS to pass filtering context from Dim Date and Dim Team into the Budget table.
Below is the DAX for deriving the Total Budget using this approach. It retrieves the correct Budget amount by applying the Year, Month and Team filters dynamically:
Total Budget =
CALCULATE (
    SUM ( 'Budget'[Month Budget] ),
    TREATAS ( VALUES ( 'Dim Date'[Year] ), 'Budget'[Year] ),
    TREATAS ( VALUES ( 'Dim Date'[Month Name] ), 'Budget'[Month Name] ),
    TREATAS ( VALUES ( 'Dim Team'[Team] ), 'Budget'[Team] )
)
Once we have the Total Budget measure, calculating the additional measures is straightforward, as in previous approaches we saw:
Budget % Achieved =
DIVIDE([Total Sales], [Total Budget])

Remaining Budget to Achieve £ =
[Total Budget] - [Total Sales]
Notice below, we have achieved the same result as we did with the previous two approaches.
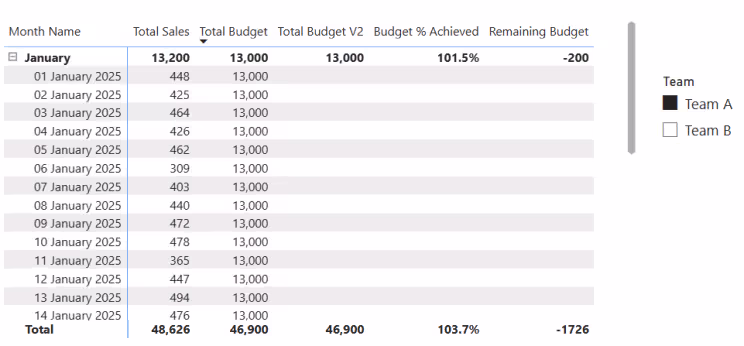
However, notice below, we not get a different type of breakdown compared to the previous approaches. This makes sense, to see the same value repeating across all the rows since we aren't establishing a relationship at day level.
I feel like there are various ways to solve this… ChatGPT 😜 So, here is one:
Total Budget V2 =
IF(
    ISINSCOPE('Dim Date'[Date]),
    BLANK(),
    CALCULATE(
        SUM('Budget'[Month Budget]),
        TREATAS(VALUES('Dim Date'[Year]), 'Budget'[Year]),
        TREATAS(VALUES('Dim Date'[Month Name]), 'Budget'[Month Name]),
        TREATAS(VALUES('Dim Team'[Team]), 'Budget'[Team])
    )
)
So, what is different? Well, I have added ISINSCOPE('Dim Date'[Date]). This ensures the budget only appears at the month level and not for each individual day, preventing the duplication across all dates. If the report is at the daily level, it returns BLANK. See below the result:
Final Thoughts
Once again, choosing between these approaches depends entirely on the organisation’s structure and reporting requirements. If day-to-day tracking, cumulative performance (WTD/MTD), and trend analysis are a focus then breaking the budget down to a daily level makes sense. If the focus is purely on monthly comparisons, keeping the budget at the first day of the month is a simpler and cleaner approach.
Ultimately, there is no best approach to the above three and it depends on what makes the most sense for the business. I hope this has been useful, and I’d love to hear how others have tackled this challenge in Power BI. Feel free to share your thoughts!
Want a free Power BI Consultation? Well look no further 😀 Book here, lets chat: Power BI Help | Free Consultation & Support | Schedule a Call with Metis BI.


.png)

.avif)
