.avif)


“The file is too large to be published. Power BI supports files up to 1024 MB”… Why is this happening!! My file is under 1GB?!
This is a scenario I keep coming across! Users running into publishing issues despite their Power BI file appearing well within the 1 GB limit. The confusion often stems from how Power BI processes and stores data in memory. Let’s break this down and dispel a common misconception by exploring two methods to determine the true size of your Power BI file (PBIX).
Before diving into the details, it’s important to understand why knowing the actual memory footprint of a Power BI file is crucial. At the core of this issue is the data model within the file, which determines its true size when loaded into Power BI. The most obvious reason for concern is the 1 GB limit imposed by a Power BI Pro license when publishing reports to the service. If the model exceeds this, publishing can be restricted.
Does File Explorer Show the True Size? No!!!
It’s easy to assume that the file size displayed in File Explorer reflects the actual size of a Power BI report, but this is misleading. While it provides part of the picture, it doesn’t tell the whole story. Let’s look at an example to illustrate why this assumption can cause confusion.

As shown in the screenshot, the PBIX file size appears as 1.7 MB (1,751 KB) when viewed in File Explorer. Additionally, when we consider all the data being imported into Power BI, the total size is higher. However, once the data is loaded into Power BI and processed in memory, the actual footprint can exceed the PBIX file size due to compression and other factors that are not reflected in the file system.
When encountering errors indicating that our Power BI file is too large, despite it appearing to be under the 1 GB limit on disk, it can be quite puzzling. However, as mentioned earlier, due to compression and other factors, the actual memory footprint of the model can exceed what is shown on disk. At the same time, it may still be smaller than the total size of the ingested data, thanks to the compression applied during processing.
Alright, so how do we determine the actual memory consumption?
Even though there are a few ways to find the true memory consumption, such as using Task Manager (even though haven't done this in a while) or connecting to the underlying Analysis Services instance via SQL Server Management Studio, I personally prefer sticking to VertiPaq Analyzer in DAX Studio.
So, what is this? Well, DAX Studio provides built-in access to the VertiPaq Analyzer. Previously, when this weren't available here we would need to use an Excel document for this that I would pick up on the SQLBI website. But anyway, this now allows us to examine the memory consumption of our Power BI model directly in DAX Studio. By establishing a connection to our PBIX file, selecting the Advanced ribbon, and choosing View Metrics, we can access a detailed breakdown of how our data model is structured and how memory is allocated.
Using VertiPaq Analyzer in DAX Studio, we can identify memory consumption, determine which objects are using the most memory and gain a consolidated view of key elements that contribute to the size of the Power BI file, such as tables, columns, hierarchies, relationships and more.
Once we connect to the Power BI model and open the View Metrics section, DAX Studio retrieves and displays the following details:
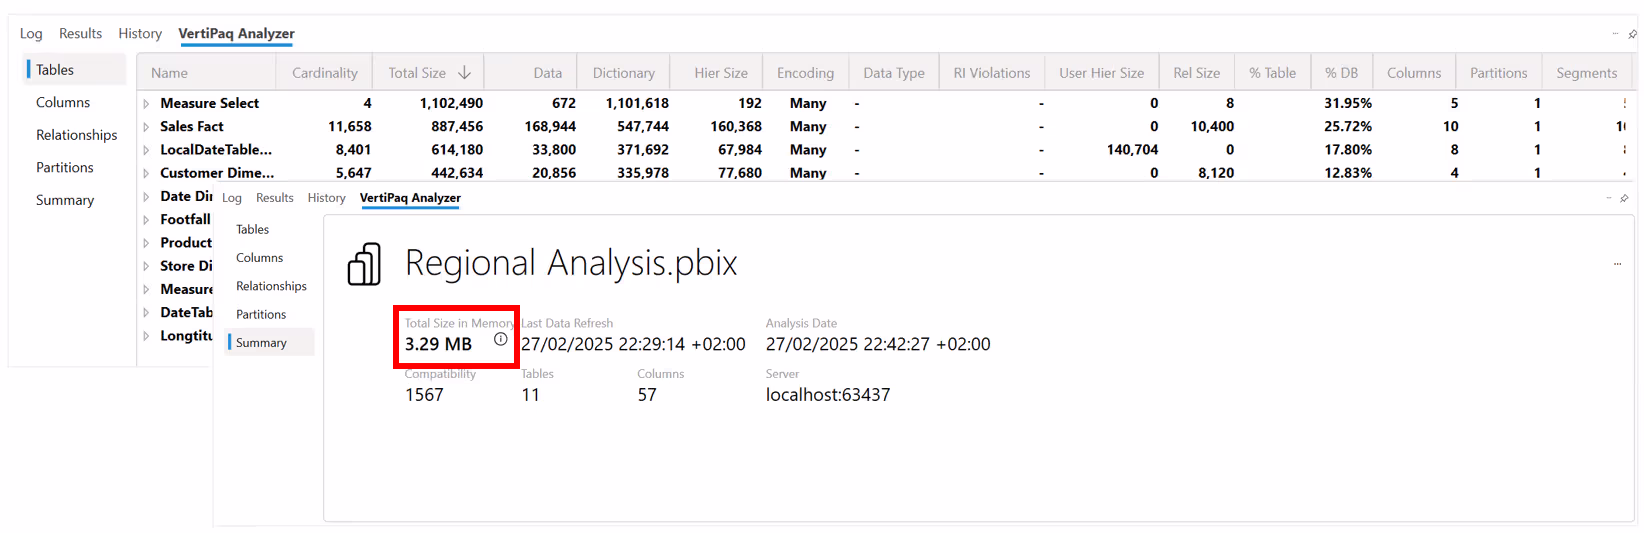
As you can see from the screenshot above, all the tables in our model are listed in the rows, along with various metrics displayed in the columns. We’re not going to dive into every detail here - this article is focused purely on measuring the true memory consumption. Also, looking at the above, we can see the total size of the Power BI semantic model comes to 3.29 MB. So, 1.7 MB compared to 3.3 MB is a big difference. Of course, the solution I am using here just uses high level dummy data for demo purposes.
Also, notice the "i" icon/tooltip which if you hover over it, it says:
"The total size is the total amount of memory used while the model is loaded into RAM. It will be different from the size of the file(s) on disk (often slightly larger because some structures are decompressed when they are loaded into memory)."
This highlights two key points. First, this figure represents memory consumption after compression. Second, don’t rely on the file size shown in File Explorer, it doesn’t tell the whole story, as I mentioned earlier!
BUT WAIT—There’s Something You Need to Know!
This one catches alot of people out! So, we just followed the steps I outlined, right? Open DAXStudio, click Advanced Ribbon, select View Metrics, and so on. So naturally,the number DAX Studio gives us the first time should be correct, right? WRONG!To explain this, I refreshed the exact same solution without making any changesto the data, transformations, model or visuals.
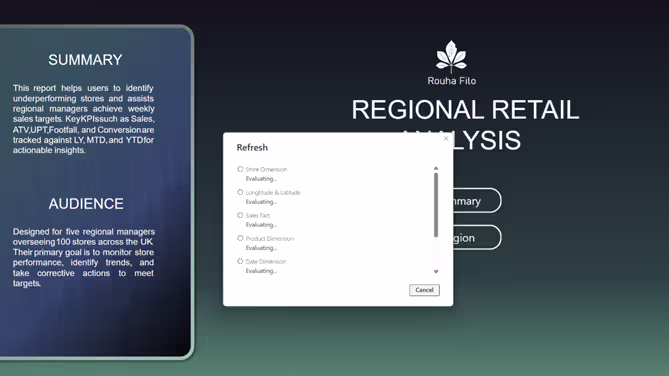
Now that I refreshed the solution, I will again connect to DAX Studio and bring up the VertiPaq Analyzer.
WOW! Look at that! Let’s recap what we’ve done so far:
- We checked File Explorer, which showed the file size as 1.7 MB.
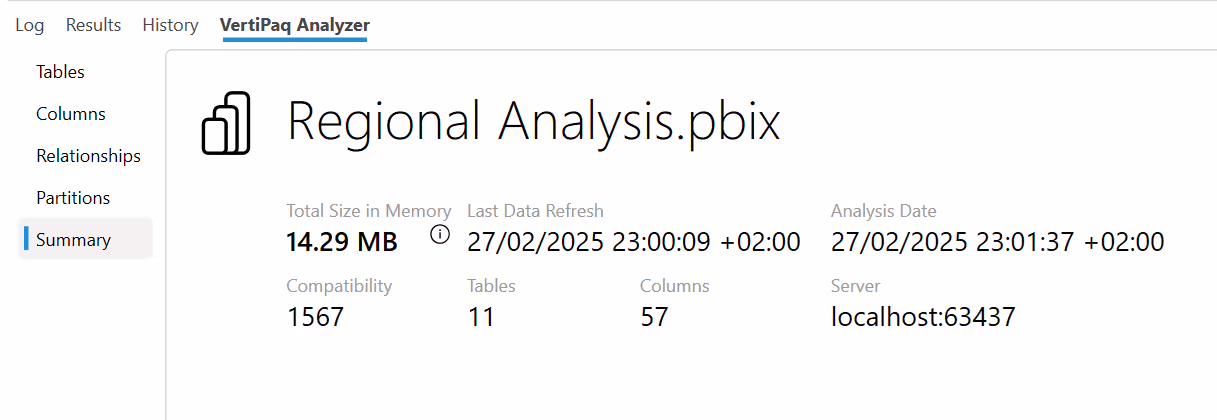
- We then opened DAX Studio’s VertiPaq Analyzer, and on the first attempt, it reported 3.3 MB.
- After refreshing the solution and reopening DAX Studio, it now shows 14.3 MB.
So, based on this, I can confidently say the TRUE memory consumption (or the closest estimate) is 14.3 MB.
Summary
Understanding your Power BI file's true memory usage is key to avoiding publishing errors and misjudging model size. The size displayed in File Explorer can be misleading, as Power BI compresses data on disk but expands it in memory when loaded. DAX Studio’s VertiPaq Analyzer is the recommendation for checking the actual memory footprint. However, even DAX Studio’s initial reading might not be accurate until after a refresh (or when you close reopen the PBIX), as we’ve seen with our example where the model size jumped from 3.3 MB to 14.3 MB.
Want to make sure your Power BI models are optimised for performance and publishing?
Check out our Power BI Performance Optimisation video, where we explain the process we follow to ensure your solution is efficient, aligned with best practices, and runs smoothly.
Still need expert help? Book a free consultation with us today:
Power BI Help | Free Consultation & Support | Schedule a Call with Metis BI


.avif)
.avif)
%20(8).png)